Sports Betting
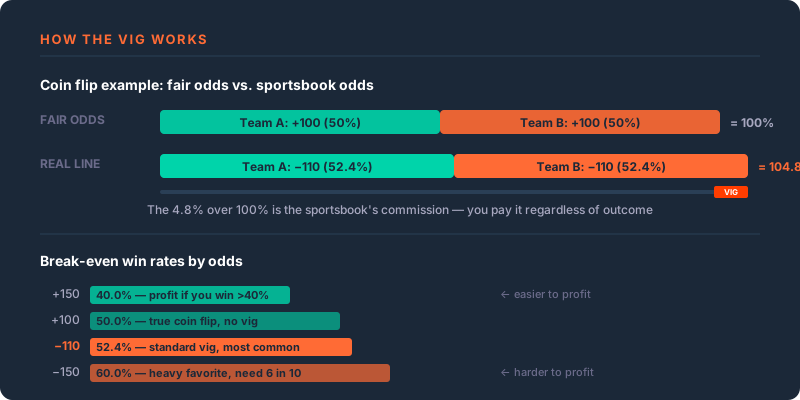
At −110, risking $110 to win $100 requires a 52.38% win rate to break even in a no-push, equal-stake model. If the true win probability is 50%, expected net loss is 4.55% of the stake. Two opposing −110 prices have 4.76% overround. Those are three different measures. A quote alone does not establish the true probability of an outcome or a guaranteed profit for the sportsbook.
Guide text revised . Sources and assumptions are linked below.
How the game works
Read the bet slip
- Identify the exact market. Check the event, selection, period and finishing or scoring condition. Winning the match and covering a handicap are different events.
- Read the accepted price. An American, decimal or fractional price describes a payout. A price shown while browsing may differ from the one accepted on the final slip.
- Check the total amount risked. Count every separate wager and all combinations in a multi-bet purchase. A possible payout is not the amount of profit.
- Read settlement conditions. Check overtime, draws, player participation, postponements, official statistics, dead heats and any void or push treatment that applies.
- Compare settled returns with total spend. A winning selection does not establish profit across a ticket, account or period.
An in-play market can change or suspend while the event continues. The fact that a person is watching the event does not establish the speed of the data they see or an advantage over a quoted price. Check acceptance and settlement rather than treating a live screen as a guarantee.
The DraftKings betting glossary is one operator’s explanation of market and settlement terms. Its examples do not replace the rules for another product or location.
Read the odds in three formats
American odds use a signed number. At −A, risk A units to win 100 units net. At +B, risk 100 units to win B units net. The sign describes the payout relationship; it does not by itself prove a true winning probability or an outcome’s rank in a market with many selections.
Decimal odds D give the total return per unit staked, including the stake. A win returns stake × D; net winnings are stake × (D − 1).
Fractional odds a/b give net winnings of a units for each b units risked. The corresponding decimal price is 1 + a/b.
Scroll sideways for all columns. With a keyboard, focus this table area and use the left and right arrow keys. Tab moves to the next control.
| American price | Decimal price | Fractional net payout | Total return on a winning $100 stake |
|---|---|---|---|
| −200 | 1.50 | 1/2 | $150 |
| −150 | 5/3, about 1.66667 | 2/3 | About $166.67 |
| −110 | 21/11, about 1.90909 | 10/11 | About $190.91 |
| +100 | 2.00 | 1/1 | $200 |
| +150 | 2.50 | 3/2 | $250 |
| +200 | 3.00 | 2/1 | $300 |
These examples use the same $100 stake and round displayed money to cents. The actual provider’s rounding and payout terms apply. A price of exactly 1.91 returns $191 on $100; it is close to −110, but it is not the exact same price.
Bet types
Scroll sideways for all columns. With a keyboard, focus this table area and use the left and right arrow keys. Tab moves to the next control.
| Market or purchase | Meaning | Terms that can change the result |
|---|---|---|
| Moneyline / match winner | Select the winning team or participant. | Whether a draw is a separate outcome, and which period or overtime is included. |
| Point spread / handicap | Apply the stated adjustment to a score before comparing the teams. | The handicap, price, scoring period and treatment of an exact tie. |
| Total / over-under | Select above or below a stated score or statistic. | The statistic, line, time period and what happens if it equals the line. |
| Proposition / prop | A named event or performance measure. | Participation requirements, official data source and settlement definition. |
| Futures | An outcome settled at a later specified point. | Completion, withdrawal, cancellation and how long the stake is committed. |
| In-play / live | Place an offered wager after the event begins. | Acceptance, changed prices, suspensions and the exact remaining or full-event period. |
| Traditional parlay / accumulator | Combine selections into one all-win ticket under its rules. | Joint probability, offered combined price, and push/void treatment. |
| Same-game parlay | Combine offered selections from the same event. | Related outcomes and product-specific repricing or settlement rules. |
| Round robin / combinations | Buy several separate combinations from a set of selections. | Number of tickets, stake per ticket and total cost. |
| Cash-out offer | An offered early settlement of an existing wager. | Whether an offer exists, its amount and the terms for acceptance. |
Two scoring examples
In a hypothetical integer-score market, Team A −6.5 wins if A’s score exceeds B’s by at least 7; B +6.5 wins if B wins or loses by at most 6. A line of −6 can instead produce an adjusted tie at a six-point margin. Check the actual market’s push rule.
For a full-game total of 48.5 with integer scores, over wins at 49 or higher and under wins at 48 or lower. This arithmetic does not decide whether overtime counts or which official score settles the product.
Parlays and settlement
The mathematical examples below use an all-win ticket with zero return on any losing leg and no pushes or voids. Real products can have different outcomes and settlement terms. DraftKings’ parlay explanation, for example, describes removing a pushed selection from its traditional parlay and recalculating the odds, while directing same-game settlement questions to separate rules. Do not assume every product handles the same leg identically.
The math
Break-even probability comes from the price
For a fixed decimal payout D, with a win or loss and no other outcomes, expected net return per unit staked is p × D − 1, where p is the true win probability. Break-even therefore needs p = 1/D.
At −110, the net equation is 100p − 110(1 − p) = 0. It gives p = 110/210, or 52.38%.
Scroll sideways for all columns. With a keyboard, focus this table area and use the left and right arrow keys. Tab moves to the next control.
| Fixed price | Break-even win rate in the stated no-push model |
|---|---|
| −110 | 52.38% |
| −120 | 54.55% |
| −150 | 60% |
| +100 | 50% |
| +150 | 40% |
Winning more than half is not a universal requirement at every price. A win rate also does not establish profitability when stakes and prices vary. Add the actual net results for those wagers.
A push that returns the stake has zero net result. If pushes are possible, distinguish the win rate among decided wagers from the rate among all wagers. Different partial-loss, dead-heat or promotional outcomes require the full outcome equation.
Expected loss needs a true probability
Assume an illustrative −110 wager has a true 50% win probability and no pushes. The expected net result is 0.5 × $100 − 0.5 × $110 = −$5 per $110 risked. That is 4.55% expected loss as a percentage of stake, or about $4.55 per $100 wagered.
The 50% is an assumption, not something established by the −110 quote. A different true probability gives a different expectation. A break-even threshold is a price calculation; it is not a forecast that a bettor will achieve it.
Overround is a separate calculation
For a complete set of mutually exclusive outcomes in the same market, convert each quote to 1 / decimal price, add the results and subtract 1. That excess is the quoted overround.
Scroll sideways for all columns. With a keyboard, focus this table area and use the left and right arrow keys. Tab moves to the next control.
| Hypothetical two-outcome prices | Sum used | Overround |
|---|---|---|
| −110 / −110 | 110/210 + 110/210 | 4.76% |
| −150 / +130 | 150/250 + 100/230 | 3.48% |
| −200 / +170 | 200/300 + 100/270 | 3.70% |
For the first row, 4.76% overround is different from 4.55% expected loss under the 50% assumption, and from 52.38% break-even probability. Do not label the difference between the break-even rate and 50% as either of those other measures.
Not every conceivable collection of prices must sum above 100%. For example, hypothetical +100/+100 prices sum to exactly 100%. A margin calculation also fails if it mixes different periods, omits an outcome or adds overlapping selections. Converting quotes does not reveal the true probabilities or prove the sportsbook’s private model.
Quoted margin is not guaranteed realized profit
Suppose an illustrative book takes $110 on each of two opposing outcomes at −110. It receives $220. With exactly one winner and no other adjustments, it pays that winner $210 total, including the returned $110 stake, leaving $10 before expenses. The $10 is 4.55% of $220 when rounded, different from the quoted 4.76% overround.
That calculation assumes balanced amounts. If all $220 is instead on the winning side, the book owes $420 total and its net result is −$200. The same quotes do not guarantee the same realized outcome when the stakes change. Operating costs and other obligations are separate from these simple cash-flow examples.
Parlays need joint probabilities
The probability of two outcomes both happening is P(A) × P(B given A). Multiplying their individual probabilities is valid when they are independent; the quote does not establish that independence.
As a toy example, two selections both describing the same fair coin landing heads each have 50% probability, but their joint probability is 50%, not 25%. Heads and tails on that same toss cannot both happen. Two separate independent fair tosses both landing heads instead have 25% probability.
The following table assumes independent selections, each with true 50% win probability, each priced at exactly −110, with the combined decimal price obtained by multiplying 21/11 for every leg. There are no fees, boosts, pushes, voids or payout caps. These are calculations, not actual offered parlays.
Scroll sideways for all columns. With a keyboard, focus this table area and use the left and right arrow keys. Tab moves to the next control.
| Legs | All-win probability | Approximate net winnings per $1 if all win | Expected loss / ticket stake |
|---|---|---|---|
| 2 | 1 in 4 | $2.64 | 8.88% |
| 3 | 1 in 8 | $5.96 | 13.03% |
| 5 | 1 in 32 | $24.36 | 20.75% |
| 10 | 1 in 1,024 | $642.08 | 37.2% |
For n legs in this model, the all-win probability is (1/2)^n, total payout per unit on a win is (21/11)^n, and expected return is (21/22)^n. This explains the increasing loss percentage under these particular assumptions. Correlated selections or a differently quoted combined price require a different calculation. Even-money prices alone do not mean each selection has a true 50% chance.
Compare measures in the game comparison.
Tips for informed play
- Read the accepted slip. Selection, period, handicap, stake and price all belong in the record.
- Keep money returned separate from profit. Subtract all stakes and applicable fees when assessing results.
- Name probability assumptions. A quoted price or knowledge of a sport does not by itself prove an edge.
- Check combined wagers separately. Related legs, changed prices and push rules can invalidate a simple multiplication.
- Choose spending and time limits before play. No generic bankroll percentage guarantees protection from losses. Increasing a stake after a loss does not make the next selection more likely to win.
- Assess complete records. A claimed success rate needs losing picks, stakes, accepted prices, costs and the period covered; selected winning screenshots are insufficient.
Sources and scope
- DraftKings glossary: one operator’s explanations of bet types and settlement vocabulary.
- DraftKings parlay explanation: named traditional-parlay push treatment and separate handling of related selections and same-game rules.
- All odds conversions, overround, expected-return, cash-flow and parlay figures here are independently calculated illustrative models. No professional win-rate range, universally safe bankroll fraction, market-profit ranking or live-data speed is asserted.
Checked September 5, 2026. These examples are not event forecasts or current price offers. Each real wager needs its own accepted price, complete outcome definition and settlement rules.
Key terms
- Stake
- The amount risked on the wager.
- Net winnings
- The gain on a winning wager after excluding the returned stake.
- Total return
- The settlement amount including any returned stake.
- Decimal odds
- Total return per unit staked on a win under the quote’s terms.
- Implied probability
- Here, the break-even threshold obtained by converting a price; not a verified true probability.
- Overround
- The excess above 100% after adding converted prices for a complete mutually exclusive market.
- Vig / juice / margin
- Informal pricing terms; name the exact calculation before assigning a percentage.
- Push
- A specified settlement returning the stake with no net win or loss.
- Void
- A canceled selection settled under the product’s refund or repricing rules.
- Handicap / spread
- A stated adjustment used to compare scores.
- Leg
- One selection within a combined wager.
- Joint probability
- The chance that the required events all occur together.
- Correlation
- A relationship between outcomes that can make an independence calculation inappropriate.
- Handle
- Total money wagered for the stated scope and period; it is not profit.
- Cash out
- An offered early settlement under the product’s terms, where available.
- Settlement
- Applying the defined result and rules to determine the wager’s return.
Common myths
What people believe, and what probability tells us.
Myth
A −110 price proves the selection has a 50% chance
The reality
The price sets a payout; true probability is a separate input.
Myth
Every percentage called vig measures the same thing
The reality
Break-even rate, expected loss and overround have different definitions.
Myth
A ten-leg ticket always has a 1-in-1,024 chance
The reality
That count requires independent selections with true 50% probabilities.
Myth
Positive overround guarantees profit on each event
The reality
Realized returns also depend on stakes, results and settlement.
Myth
Knowing the sport guarantees profitable selections
The reality
A useful forecast must be assessed against the price, costs and complete results.
Myth
Watching live guarantees an information advantage
The reality
A live screen alone does not establish data speed or a profitable price.
Knowledge check
Pick an answer to reveal the explanation. Nothing is scored or saved.
Part of the Playbook Brand system, the open, public-domain core for player education. You can copy and adapt it under CC0.